
Every share we recommend passes through four systems we built ourselves: a screen of the whole market, research on each company, live management of every portfolio, and performance checked against your custodian to the penny.

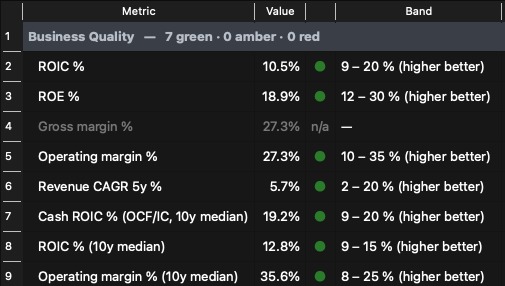
The whole market screened down to the strongest value candidates.
Quality first, then value, then the case for and against.
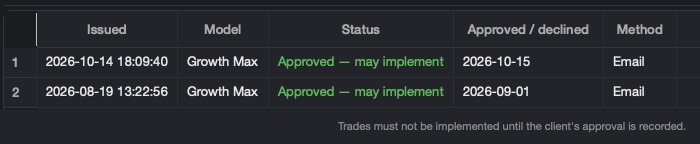
Every account run to its model, with every trade approved by you.
Returns measured from your custodian's records and compared with the market.
Each market is screened as a whole: every actively traded company above £1 billion on the London Stock Exchange, with the same done for US-dollar and euro listings. Every stage narrows the field and lists the names it removed, so nothing is dropped silently. Quality decides whether a share may be owned; value decides where it ranks.
Every actively traded company above £1 billion, in every sector. Funds, investment trusts and secondary listings are left out, and a company listed in several places is counted once.
Companies with too much debt for their sector are removed first: net debt above 2.2 times EBITDA (1.7 for cyclicals and housebuilders, 3 for utilities), debt above equity, or interest covered less than five times. Banks, insurers and asset managers are judged on their own terms later.
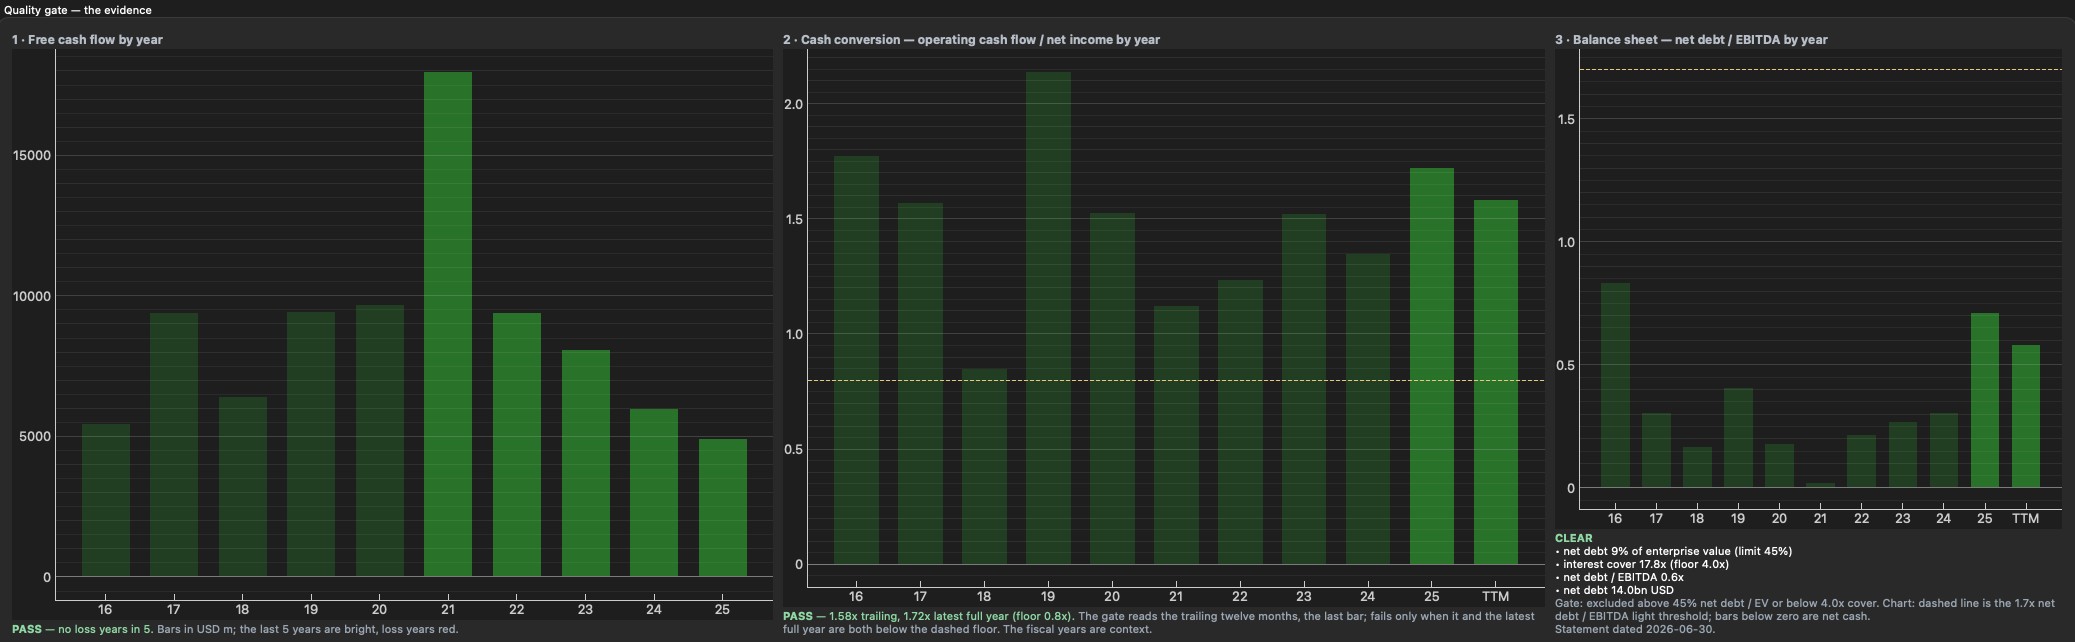
Each company is fetched in full and scored. The quality gate asks whether the share may be owned at all: free cash flow in at least four of the last five years, profits that turn into cash, and a balance sheet that can carry a downturn. The value score then ranks the eligible names from 0 to 100 against fixed yardsticks on earnings, cash flow, enterprise value and the growth the price assumes, never against each other.
The 40 highest-scoring eligible companies go to an AI review, which reads each company's full record and returns ten candidates, each with the reasoning, the key risk and one thing to check in research. Those ten go to our Value Research app, where the decision is ours.
Company data from Financial Modeling Prep.
Every company we consider for our portfolios goes through the same disciplined process, built in-house at OLBOS Capital.
We start with the business itself. Does it turn its profits into real cash, year after year? Is its balance sheet strong enough to carry it through a downturn? Only companies that pass these tests go forward.
We measure the share price against fixed yardsticks: what the company earns, the cash it generates, how it compares with its industry, and the growth the price already assumes. From this we set our own 12-month expected return, made up of dividends, share buybacks and a gradual move towards what we judge the business to be worth.
For each company we set out the case for and against, the key risks, and the events that would make us review our view. Independent analysts' opinions are shown alongside our own for context.
Every recommendation is made by our investment team and recorded in a research report held in our library. Each holding is reviewed whenever new results or events arrive.

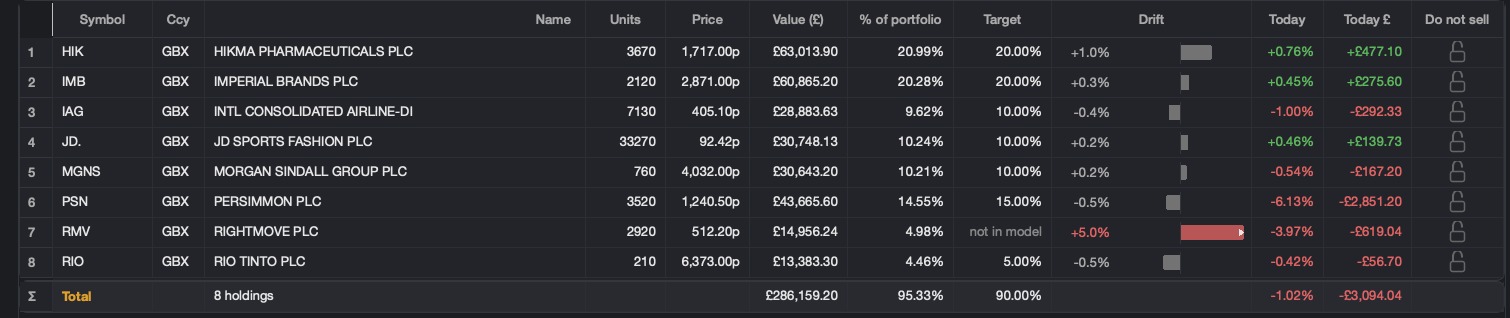
Every OLBOS Capital portfolio is managed with our own portfolio system, built in-house for the way we invest. It gives us one live view of each client's account. We can see what you hold and what it's worth, and how it's performing today, this month and since you joined us.
Each account follows one of our strategies: OLBOS Secure, OLBOS Growth or OLBOS Growth Plus. The system shows us at a glance where your holdings sit against the model. When something drifts beyond our set limits, we can prepare a rebalancing recommendation for you to approve. Holdings you want to keep are always respected.
Your returns are drawn from your custodian's statements and updated each day. We compare them with the market over exactly the same dates, so you always know how your portfolio has done against the index.
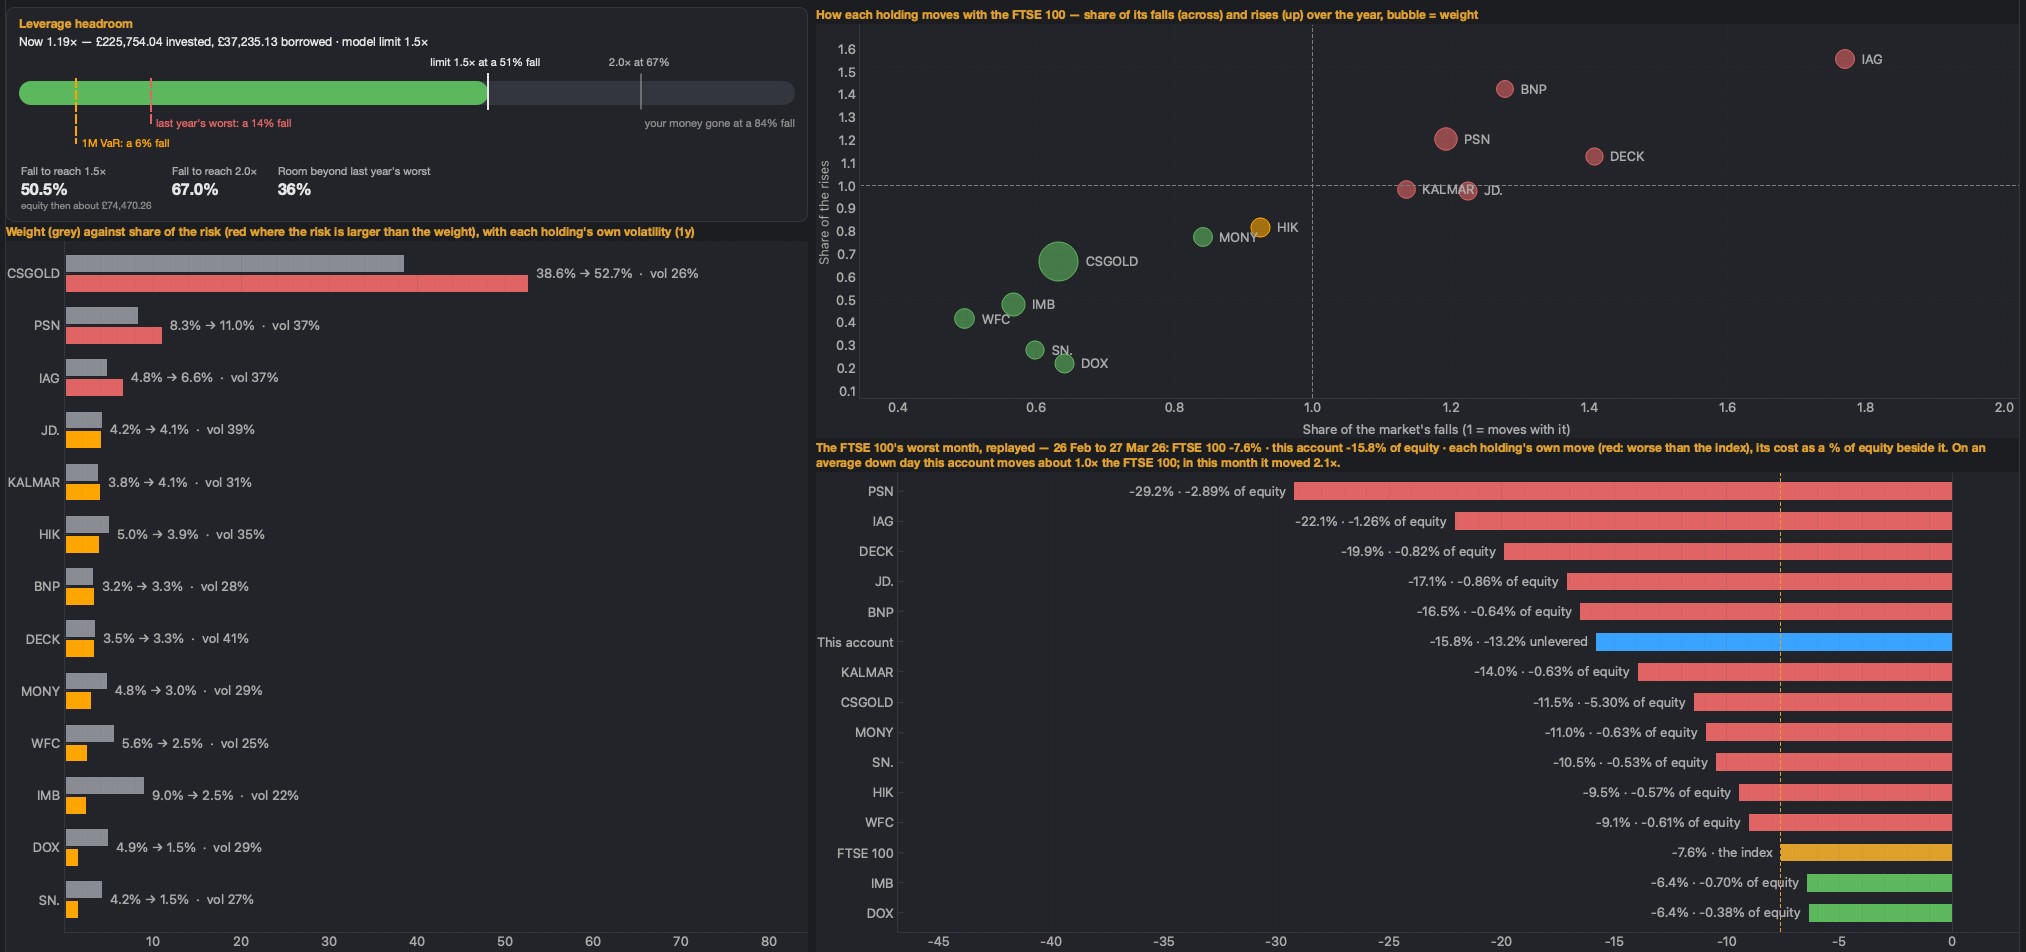
We look beyond the headline numbers. We see which holdings drive your portfolio's ups and downs, how each one behaves when markets fall, and how much room there is before borrowing limits are reached. We look through to the companies themselves, including the debt they carry, so the risk you take is the risk you chose.
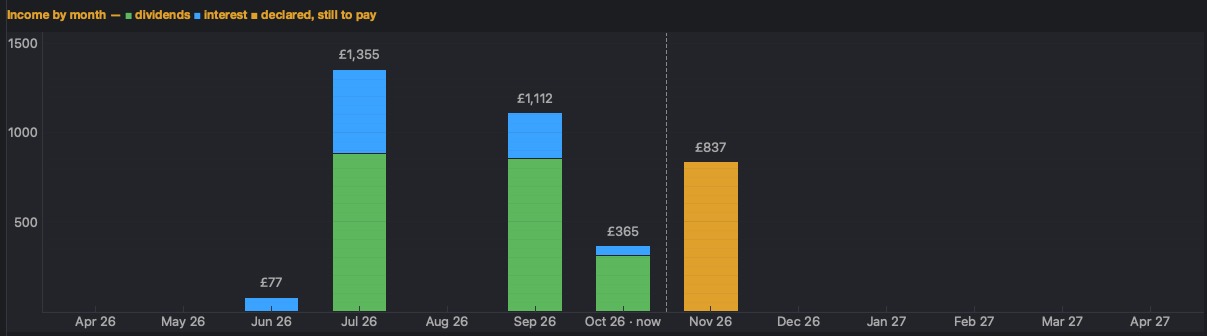
We track every dividend and interest payment you receive, the dividends declared and on their way, and where your income comes from.
At any time we can produce a concise snapshot of your portfolio: its value, performance, risk and income, set out in plain English.
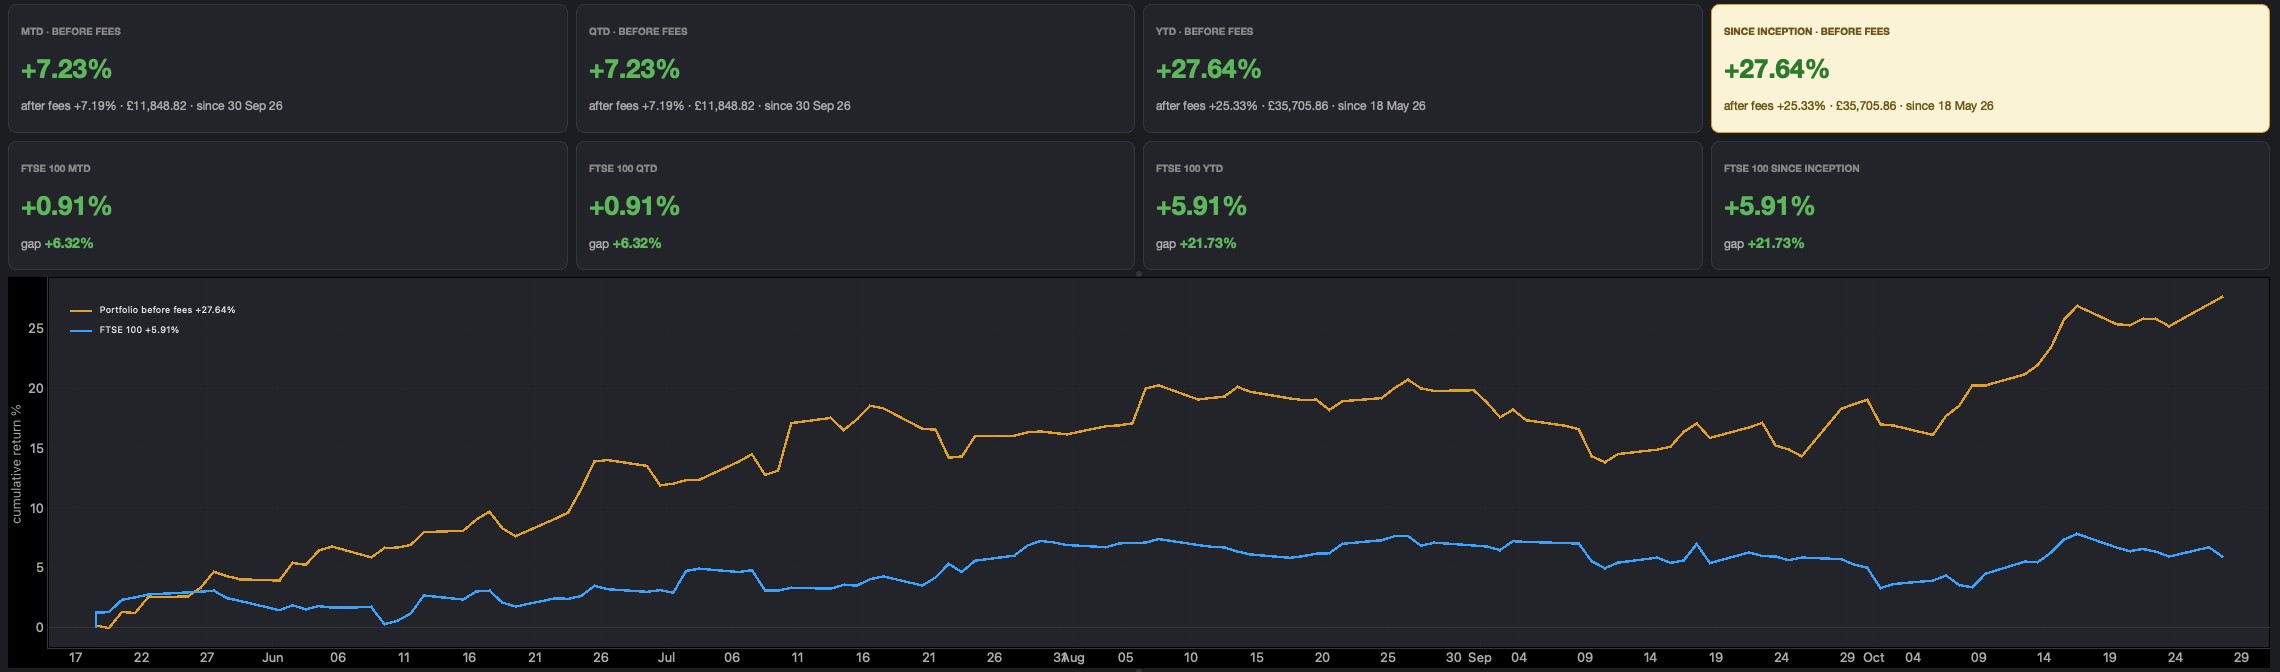
At OLBOS Capital you always know exactly how your investments are doing. Our performance system builds a complete record of your account from your custodian's own reports, covering every purchase, sale, dividend and payment. It then checks that record against the custodian to the penny, so the figures you see are figures you can trust.
Your return is measured with the industry-standard time-weighted method, so money you add or withdraw never distorts how well your investments have done. We show your return after all charges for the month, quarter and year to date and since you joined. Alongside it you'll see major markets such as the FTSE 100 and MSCI World over exactly the same dates.
We break your return down by holding, by sector and by industry, so you can see which investments added most and where the gains came from, including the dividends your shares paid along the way.
You'll receive a clear, professional report showing your portfolio's growth day by day, its progress month by month and how it compares with the market. Every figure is grounded in your custodian's own records.
Thirty minutes on Teams or by phone, any day with 24 hours' notice. We will tell you honestly whether OLBOS Capital is the right fit.
Book a 30-minute callCall +44 1622 958990Already spoken to us? Complete your application →